Using the Server Metrics Graph
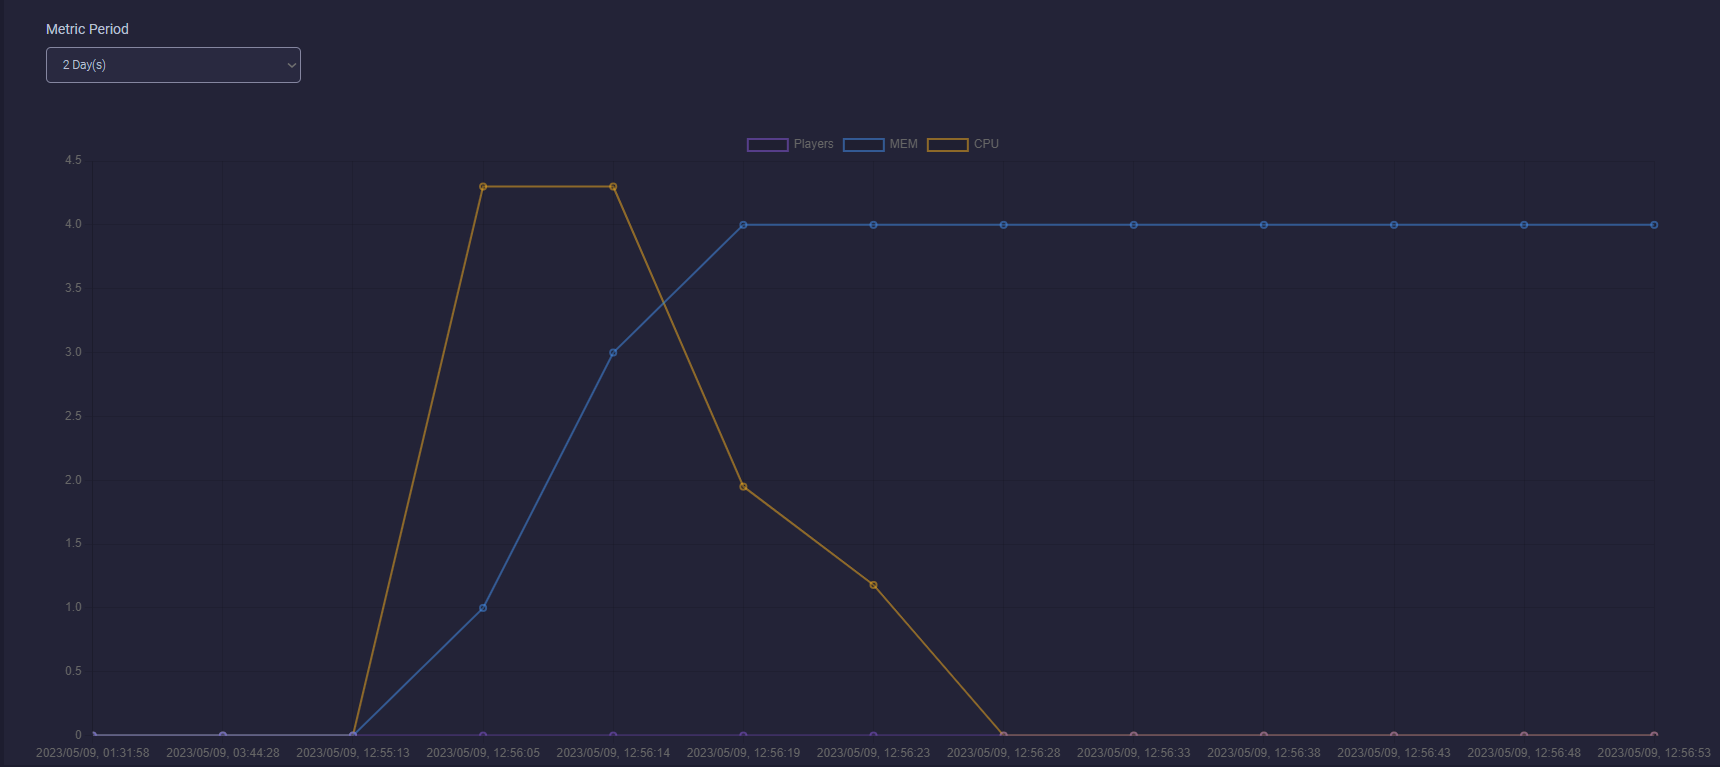
The metrics graph panel provides a visual representation of key server metrics within Crafty, offering insights into system performance and usage trends.
With a simple and intuitive interface, the metrics graph panel can display metrics data spanning the past three days, allowing you to monitor important trends and patterns.
While there are minimal configuration options available for this panel, it provides valuable information at a glance.
It's important to note a known issue where zooming out on the graph with large datasets may cause performance issues due to unpruned point data.
Graph Manipulation
To zoom on the graph hold Shift , then use your scroll wheel.
Alternatively hold Shift , then click and drag the area you'd like to zoom in on.